Zemědělské plánování oslunění založené na datech
Mapujte sluneční expozici na své půdě, zjistěte, které plodiny budou kde prospívat, a modelujte úrovně osvětlení ve sklenících — vše z reálných 3D dat terénu a klimatu.
Bez SunTrace3D
Hádání o oslunění polí
Výnosy plodin závisí na přesných hodinách slunečního svitu, ale většina farmářů se při přidělování polí spoléhá spíše na intuici než na data.
Terén ovlivňuje světlo nepředvídatelně
Svahy kopců, okolní budovy a větrolamy vytvářejí složité vzory stínů, které se mění s ročními obdobími.
Umístění skleníků je pokus-omyl
Umístění skleníků pro optimální osvětlení vyžaduje pochopení okolních stínů a sezónních úhlů slunce.
Se SunTrace3D
Teplotní mapa slunečního svitu pro každé pole
Barevně kódovaná překryvná vrstva ukazuje přesné hodiny slunce na celém pozemku s ohledem na terén, budovy a větrolamy.
Zóny vhodnosti plodin
Podívejte se, které plodiny odpovídají podmínkám oslunění v každé oblasti. Databáze rostlin zahrnuje požadavky na slunce a kompatibilitu s klimatem.
Modelování osvětlení skleníku
Konfigurujte skleníky s nastavitelným prostupem světla sklem. Podívejte se na realistické úrovně osvětlení uvnitř s ohledem na filtraci skla a okolní stín.
Mapování vhodnosti plodin
Překryjte zóny vhodnosti plodin na základě skutečných hodin slunečního svitu, vegetačního období a místních klimatických dat. Podívejte se, které plodiny budou prospívat v každé části vaší farmy.
Teplotní mapa oslunění
Překryjte barevnou teplotní mapu zobrazující roční sluneční expozici na celém pozemku. Okamžitě identifikujte nejslunnější a nejstinnější zóny.
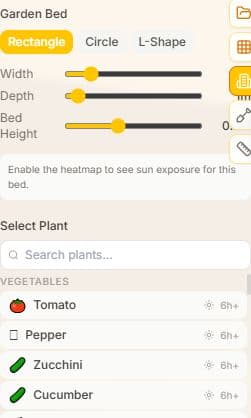
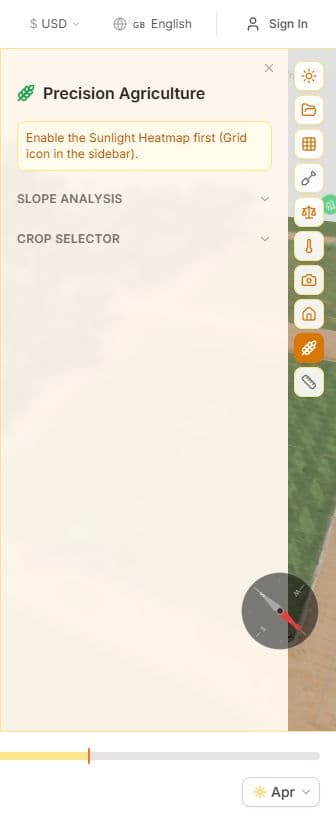
Plánovač zahradních záhonů
Navrhujte zahradní záhony a vybírejte z databáze rostlin vhodných pro vaše podmínky oslunění. Plánujte, kam umístit slunce milující nebo stín snášející druhy.
Analýza svahu a orientace
Analyzujte sklon a orientaci terénu pro pochopení odtokových vzorců vody a vlivu orientace svahu na sluneční expozici různých typů plodin.
Modelování osvětlení skleníku
Konfigurujte skleníky s nastavitelným prostupem světla sklem. Teplotní mapa slunečního svitu ukazuje realistické úrovně světla uvnitř s ohledem na filtraci skla a okolní stín.
Globální pokrytí
Analyzujte libovolnou adresu na Zemi. Fotorealistické 3D modely dostupné pro města po celém světě, se satelitními daty o ozáření pokrývajícími každou lokalitu na planetě.
Jak to funguje
solutions.howItWorksSubtitle
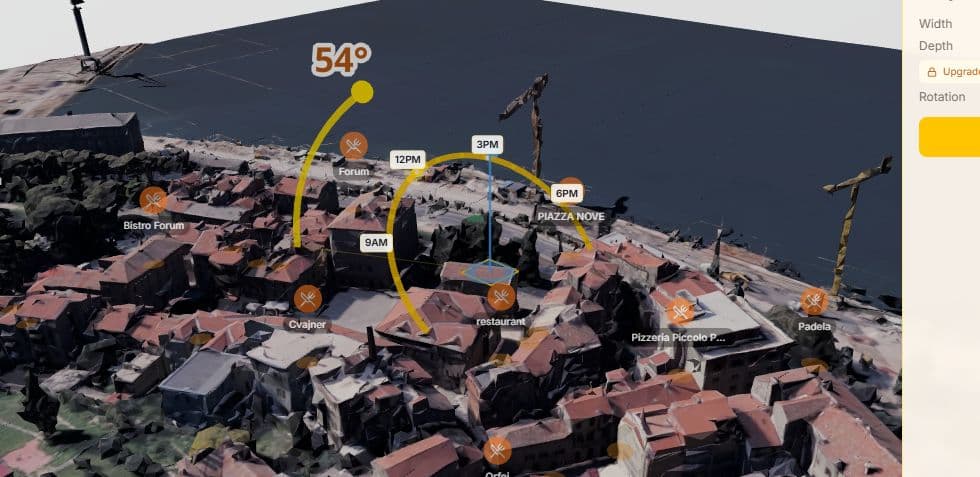
Načtěte svou farmu ve 3D
Zadejte adresu a podívejte se na svou půdu se vším okolním terénem, budovami a větrolamy ve fotorealistickém 3D.
Zmapujte zóny slunečního svitu
Zapněte teplotní mapu slunečního svitu pro zobrazení sluneční expozice hodinu po hodině a sezónu po sezóně na celém pozemku.
Plánujte plodiny a skleníky
Použijte selektor plodin a nástroje pro skleníky k plánování rozvržení na základě reálných dat o slunečním svitu pro maximální výnos.
Často kladené otázky
Bere v úvahu sklon a orientaci terénu?
Ano. 3D modely zahrnují reálnou geometrii terénu. Jižní svahy dostávají více slunce, severní svahy méně — vše se odráží v teplotní mapě a analýze vhodnosti plodin.
Mohu vidět oslunění pro konkrétní vegetační období?
Ano. Použijte měsíční zobrazení teplotní mapy pro libovolný měsíc v roce. Sledujte, jak se vzorce světla mění od sezóny sázení po sklizeň.
Jaké plodiny jsou v databázi?
Databáze rostlin obsahuje přes 50 druhů zeleniny, bylinek, ovoce, květin a keřů — každý s požadavky na hodiny slunce, zónou odolnosti a daty o vegetačním období.
Jak funguje modelování skleníku?
Umístěte skleník do scény, nastavte prostup světla sklem (30–95 %) a teplotní mapa slunečního svitu ukáže realistické úrovně osvětlení uvnitř s ohledem na filtraci skla a stín z okolních struktur.
Funguje to pro velké zemědělské plochy?
Ano. 3D modely pokrývají plochy do několika stovek metrů. Uživatelé Pro mají rozšířené pokrytí teplotní mapy (poloměr 100 m) pro větší farmářské plochy.
Připraveni zmapovat sluneční svit na své půdě?
Začněte zdarma — bez platební karty